A couple of years ago, I had a one-on-one with a teammate at Mixmax who was feeling frustrated at work and wanted to vent. (As much as we love talking about our great engineering culture and how we support each other and help each other grow, we also know that no one person or workplace is perfect. We can always improve!) I left the conversation finding myself really agreeing with my teammate and his feedback about some of the bad cultural patterns on our team that were causing him to feel burned out.
At the time, though, I was working as an IC software engineer on a team of fifteen, and I knew that we couldn’t just change things because two of us wanted them to be different. Improvements to our work culture needed to serve the whole team, and be driven by evidence. So I paused my coding tasks for the day and started trying to figure out a way to learn what everyone on the team was feeling. After a couple weeks of working on it in the “10% time” that Mixmax gives all engineers for passion projects, I came up with the result: our first engineering culture survey.
Survey Development
The first step in developing our engineering culture survey was answering the age-old question: build or buy? In general, my bias is typically to buy rather than build. At startups especially, you have a limited amount of time and effort that you can spend on innovations, and it’s often better to buy an off-the-shelf solution rather than building one you’ll have to maintain forever. However, when I looked around at off-the-shelf survey solutions, I found that they were too generic for my use case. I wanted something that was specifically tailored to an engineering team, with questions about things like code quality and prioritization. Figuring that a simple MVP survey in a Google Form couldn’t be that hard to maintain, I decided to compile a list of questions for the team myself.
The next step was getting survey-building advice from people who actually know what they’re doing. I’m an engineer, not an HR professional, and while I was interested in knowing how sentiment on the team broke down against anonymized demographics, I also didn’t want to ask anything inappropriate, or anything that might make my teammates uncomfortable. I took the idea for the survey to Mixmax’s Head of People and we started working together on assembling a question bank.
One of the first things we realized was that the wording of questions on a survey like this is important. Little nuances in phrasing can really change the sentiment of responses that surveys provoke from respondents. As it turns out, designing survey questions is an entire cottage industry, and folks like Pew Research and Gallup spend huge amounts of effort figuring out how to word questions in ways that aren’t biased. As a result, our Head of People and I decided to only use questions that had been phrased by trusted sources like Gallup. We looked at publicly available corporate engagement surveys from a number of different sources and took the questions that seemed relevant to our team.
Next, we wanted to make sure that the questionnaire would be painless for the team to fill out. We chose to cap the number of multiple-choice questions we asked at thirty and the number of free response questions at three. This way, the survey didn’t take too long to either fill out or to present the results of. To keep things simple while allowing for neutrality, we also decided to use a five-point Likert scale ranging from “Strongly Disagree” to “Strongly Agree” for our multiple-choice questions.
Finally, we wanted to set ourselves up for the possibility of team-split analysis by getting demographic data about the respondents. We decided that, to preserve anonymity, we wouldn’t ask any demographic questions that might identify a group of three people or fewer. We also chose to make every demographic question optional. Because of the small size of our team, we gathered information about tenure at Mixmax, team assignment, and geographic location to inform our analysis, rather than asking questions about gender or ethnic identity.
With all this in mind, we produced the Mixmax engineering culture survey, which we now administer biannually. Here’s the latest version:
The Survey
-
Overall Satisfaction
-
I am proud to work at Mixmax.
-
I feel confident I can develop my career at Mixmax.
-
Fairness
-
My job performance is evaluated fairly.
-
People from all backgrounds have equal opportunities to succeed on Mixmax’s engineering team.
-
I feel sufficiently recognized for my contributions.
-
Opportunities & Resources
-
I have opportunities to learn at Mixmax.
-
When there are technical or career opportunities on the engineering team, I am aware of them.
-
The information and resources I need to do my job effectively are readily available.
-
The Mixmax engineering team believes that people can always greatly improve their talents and abilities.
-
Working on the Mixmax engineering team enables me to balance my work and personal life.
-
Decision Making
-
I am included in decisions that affect my work.
-
I am satisfied with how decisions are made on Mixmax’s engineering team.
-
The Mixmax engineering team carefully plans work.
-
The Mixmax engineering team prioritizes work correctly.
-
Quality
-
The Mixmax engineering team completes work on time.
-
Mixmax’s developer experience enables high-quality work.
-
Maintenance and support work is fairly distributed among team members.
-
Voice
-
When I speak up at work, my opinion is valued.
-
I can voice a contrary opinion without fear of negative consequences.
-
On Mixmax’s engineering team, there is open and honest two-way communication.
-
Belonging
-
I can be my authentic self at work.
-
I know my teammates as well as I’d like to.
-
My teammates and I know what each other are working on, and support each other when we need help.
-
I feel respected as part of the engineering team.
-
I feel respected and valued by my manager.
-
Diversity
-
The Mixmax engineering team values diversity.
-
Motivation
-
I understand how my work contributes to Mixmax’s mission.
-
The work that we do on Mixmax’s engineering team is important.
-
I feel that I am given autonomy at work.
-
I feel competent at work.
-
I feel a sense of belonging and connection to my teammates at work.
-
Free Response
-
What are the best parts of working on the Mixmax engineering team?
-
What are the worst parts of working on the Mixmax engineering team?
-
Which of our Mixmax engineering team principles (“Amplification”, “Quality”, “Intentionality”, “Ownership”) do we best execute? Which do we not?
Analyzing the Survey
After sending out the survey (… and a couple of reminder messages …), I was really excited to get a 100% response rate from the team. But actually collecting the data was only half the battle. Next, I had to analyze the results and present my findings.
Once you’ve gotten data from your respondents, there’s really any number of ways you can slice and dice it. Should you take on your own survey analysis, I encourage you to think creatively about how to break down your results! Since our survey was meant to be quick and dirty, the first time I ran the results analysis, I cut a few corners. For instance, with five-point Likert scales (that range from “Strongly Disagree” to “Strongly Agree”), you’re technically not supposed to use the mean as a measure of central tendency, since there’s no way of knowing whether the gaps between “Neutral”, “Agree”, and “Strongly Agree” are the same. Similarly, standard deviation also technically shouldn’t work for these multiple-choice questions. But since the real goal of the analysis is to provoke a useful conversation about cultural improvement with your team, it’s not necessarily true that every part of the analysis needs to be mathematically precise. Here are a few ways that I’ve broken down Mixmax survey results, just to inspire you:
- Mean response value to every question
- Median response value to every question
- “Most controversial questions”, sorted by standard deviation of responses
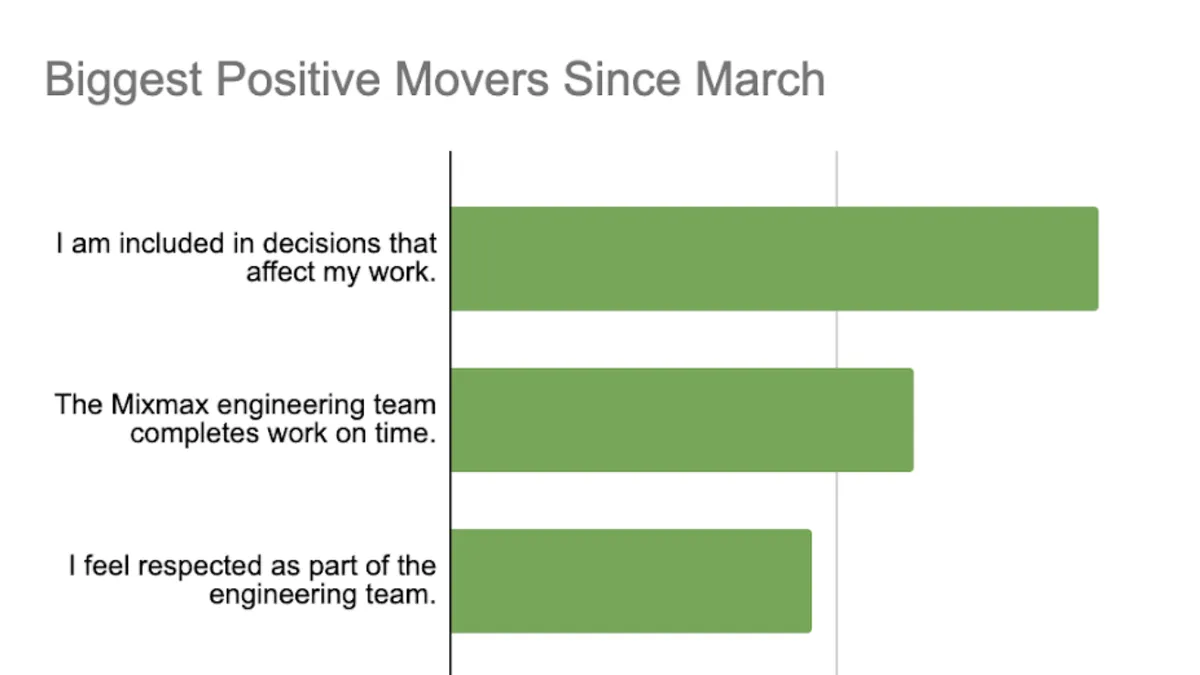
- Most changed questions (since the last time the survey was run)
- Most differentiated questions by group, using the demographic splits to divide responses
Free response questions are a little trickier, since the goal is to preserve anonymity while still aggregating the data. Generally, my approach has been to bucket the responses (for example, count the number of mentions of “the developer environment” in responses to the survey question, “What’s the best part of working at Mixmax?”). Then, I compile a list of the most frequently mentioned pluses and minuses, enhanced with some representative direct quotes from the free response.
Once I had this analysis, I presented it as a slideshow to the team at our biweekly engineering all-hands meeting in a slideshow format. In my presentation, I identified a few potential key insights as conversation-starters for after the presentation (one example: “The most controversial question was the one about work-life balance.”). After we’d talked over those, the team shared their own ideas about the interesting tidbits they’d gleaned. We then took those key insights into later follow-up meetings where we came up with actionable plans to preserve the best parts of our engineering culture, while shoring up weaknesses. Keep in mind that these later “breakout conversations” and the actionables that came from them were the real goal of the whole process! Letting people choose which issues they cared to participate in during the breakout discussions (and ideate on solutions for) led to a number of positive changes for our engineering culture that the whole team had bought in on.
Another decision that proved valuable for us later was running the exact same survey multiple times. We’ve now conducted this survey on four occasions over two and a half years. Watching for changes in the responses to certain questions has let us know if we’ve been successful or not on making the improvements we wanted to. For instance, after our most recent survey, we knew we needed to resource improvements to our local developer environment. On our next survey, we’ll see how those improvements show up in the results!
FAQs and Gotchas
I’ll close out with a few more minor tips and tricks for running a smooth survey process.
- We chose to make responses anonymous to increase the sense that it was safe to be honest. I’d recommend that you do the same; you may feel safe putting your name on your feedback, but not everyone on the team may agree.
- You should be very clear with your team up front about who will have access to their anonymous responses. Knowing if their manager or the CEO will read what they write can really change what people will say. You must absolutely not betray your team’s trust by sharing the data with someone that you didn’t tell them you would.
- In our case, I think it wound up being beneficial that the person running the survey wasn’t a manager. Your mileage may vary. For me, an IC who was interested in becoming a manager someday, this was a great “intro to leadership” project.
- It’s best to have multiple people who are participating in the survey design and analysis process, if only so that someone knows how to run the survey if anyone leaves. If designing your own questions, try to include a diverse group of people to work on the survey.
- Keep presentations on results short to provoke discussion. I’ve found that if I present all the numbers I’ve pulled at once, eyes start to glaze over in the all-hands. Instead, splitting the presentation in half allows the team to stay more focused, as well as to ask questions after Part One that you can dig in on and report back to in Part Two.
- Try to run the survey at a recurring cadence that balances being frequent enough to check up on progress from the last round with not burning the team out on surveys. We chose every six months.
- When I became a manager later on in my Mixmax career, I found that being able to share insights from the engineering culture survey to candidates in the recruiting process was a really great way to explain to applicants in an evidence-based way what’s so awesome about working here.
With all that said, I think this wound up being a really valuable way for our team to regularly check in on our culture and identify the great parts we want to celebrate, as well as the parts that can be changed for the better. It’s really helped us to continuously improve, and I hope that it can help you too.
If you’re interested in joining a reflective and iterative engineering team and working on our culture with us, check out our open positions!
Happy surveying!