


In a competitive sales platform products market, prioritising user satisfaction is crucial. Whether it's a website, application, or service, ensuring users are happy is key to success. Real User Monitoring (RUM) dashboards play a vital role by providing real-time insights into how people use our Mixmax product, guiding us to make informed decisions that directly impact user experience and quality.
At Mixmax, we aimed to understand how users experience our system and identify their problems when they arise. Our product can be complex, making it tough to replicate exactly what users do. We were working on ways to better grasp user behaviour and their challenges so we can improve their experience. The introduction of RUM dashboards was a perfect solution. RUM dashboards allowed us to monitor and measure user experience, leading to increased overall user satisfaction and a reduction in system errors. Let’s dive into those specifics!
Understanding User Behaviour Clearly
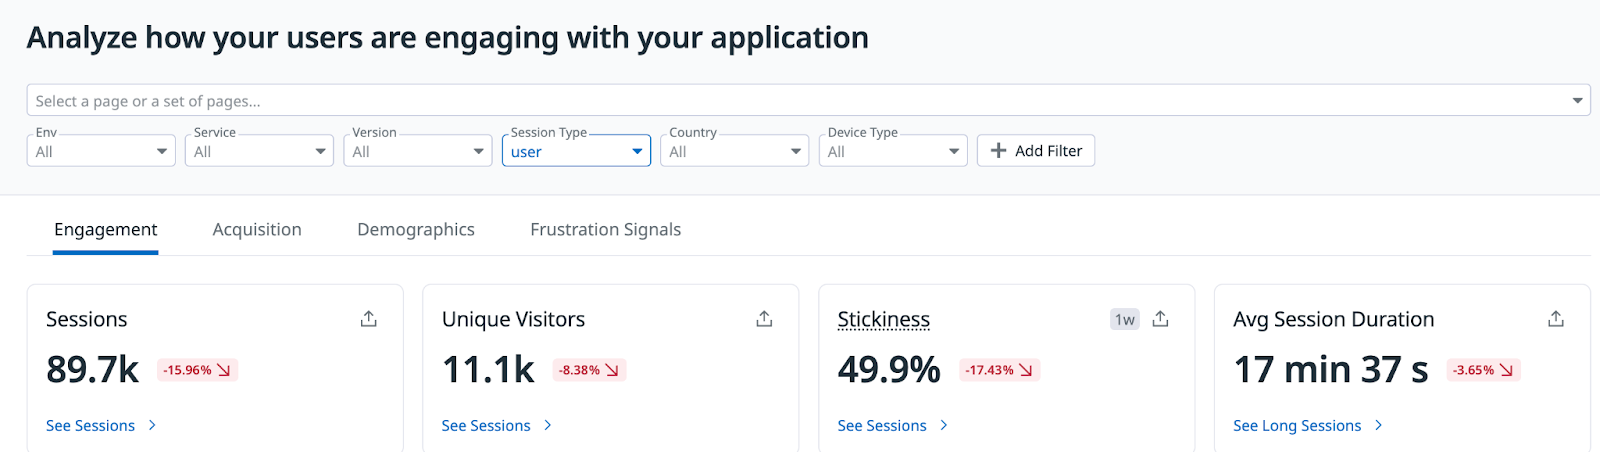
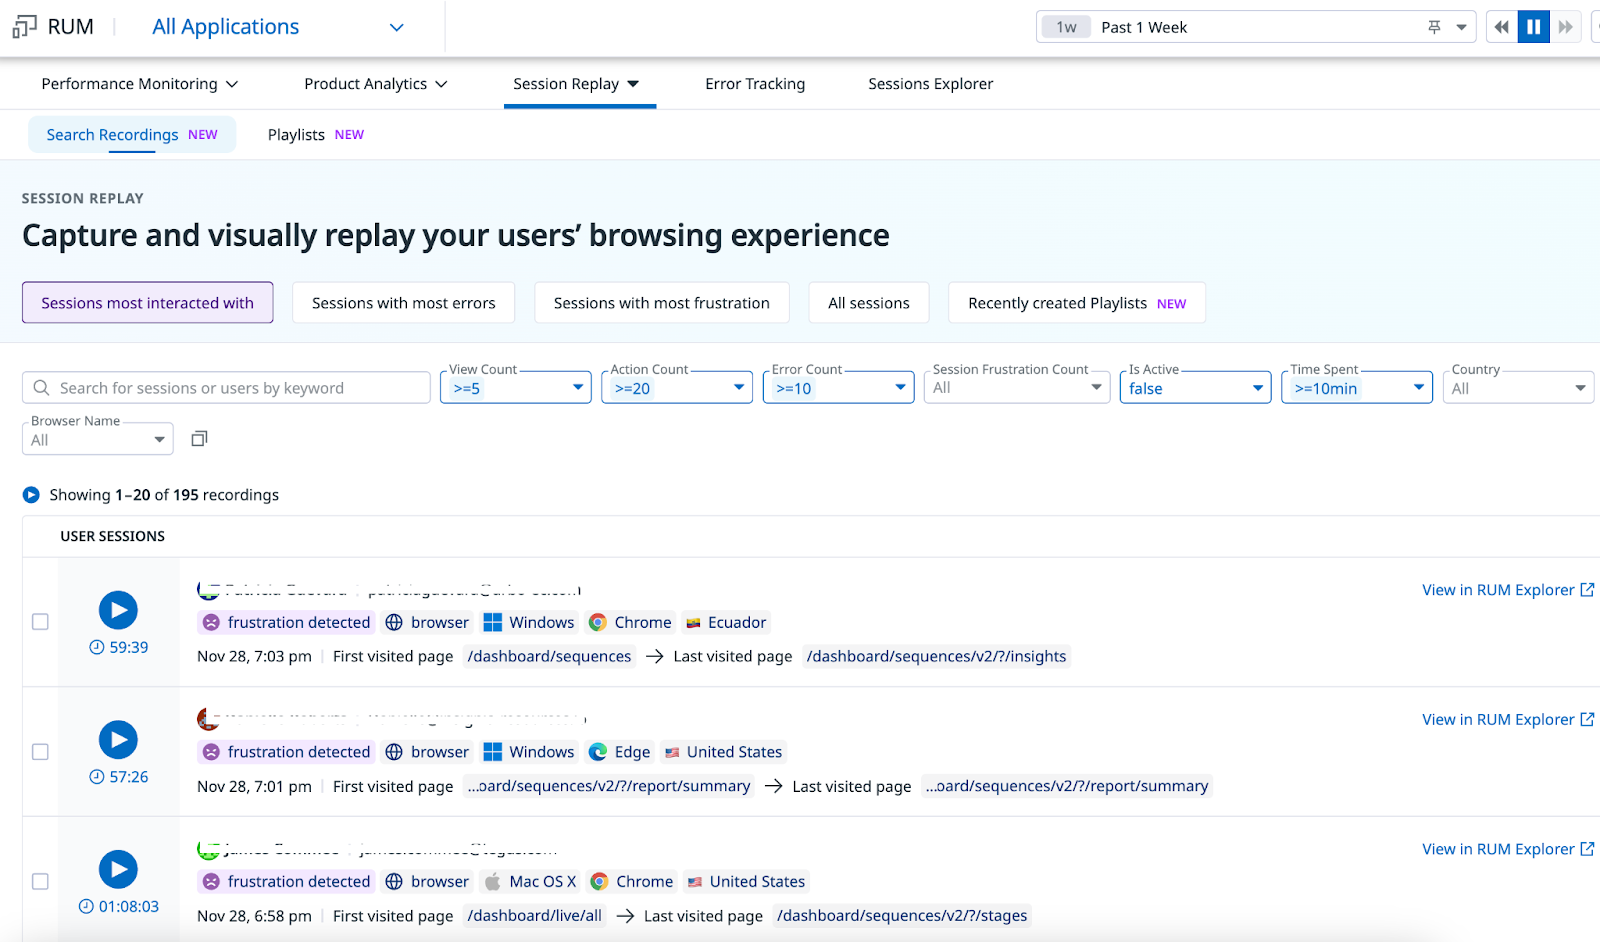
 RUM dashboards gave us a clear view of how people interact with our product. It showed us things like page load times, what users click on, and where issues arise. This information helps us identify problems, improve functionality, and create a better experience for users. Also, there is a possibility to instrument these metrics, called RUM session reply, and enable video recordings of a user's interactions.
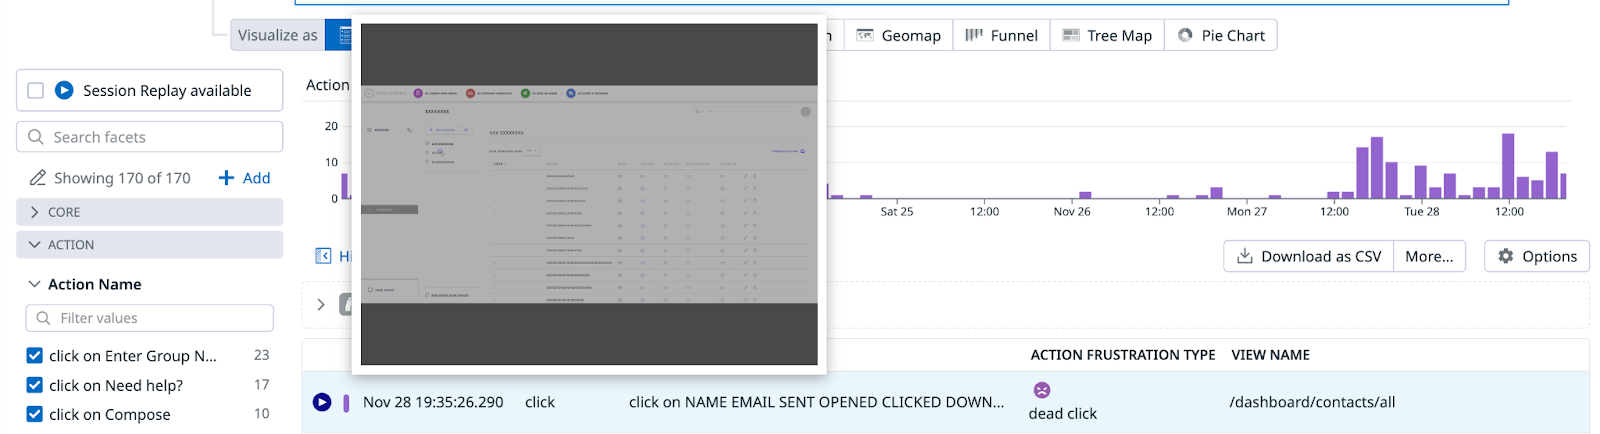
Clicking on the given error event log, it will lead you to the entire video execution of a failed flow. You don’t need to worry about confidential user data, as user data is anonymised here.
At Mixmax, we've incorporated frustration signals into our overall quality metrics and service health monitoring across various services that teams own. By tracking these signals, we gain valuable insights into user flows, allowing us to better understand user experience. This helps us address issues that often accompany customer support incidents, particularly those arising from ambiguities. Additionally, it helped us in daily debugging tasks.
Rapid Problem Detection and Resolution
One great thing about RUM dashboards is their ability to easily detect issues. Identifying problems quickly allows us to address them promptly, minimizing user frustration and ensuring our platforms function smoothly.
Monitoring Frustration Signals for Improvement
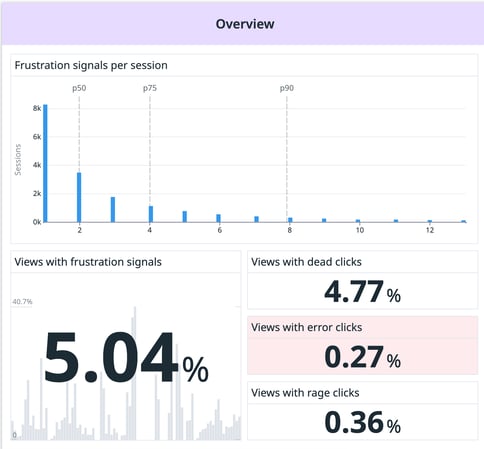
These dashboards not only track user actions but also help us spot when users face frustration. Metrics like dead clicks, error clicks, and rage clicks signal areas where users might be getting frustrated. Fixing these issues was crucial to enhance the overall quality of our product.
Dead Clicks, Error Clicks, and Rage Clicks are metrics that we rely on in the RUM dashboard.
Dead Clicks:
Dead clicks refer to instances when users click on elements within an application that don't respond or lead to any action. These clicks essentially go nowhere, providing no expected outcome or functionality. Dead clicks might occur due to non-responsive buttons, broken links, or elements that lack the intended functionality.
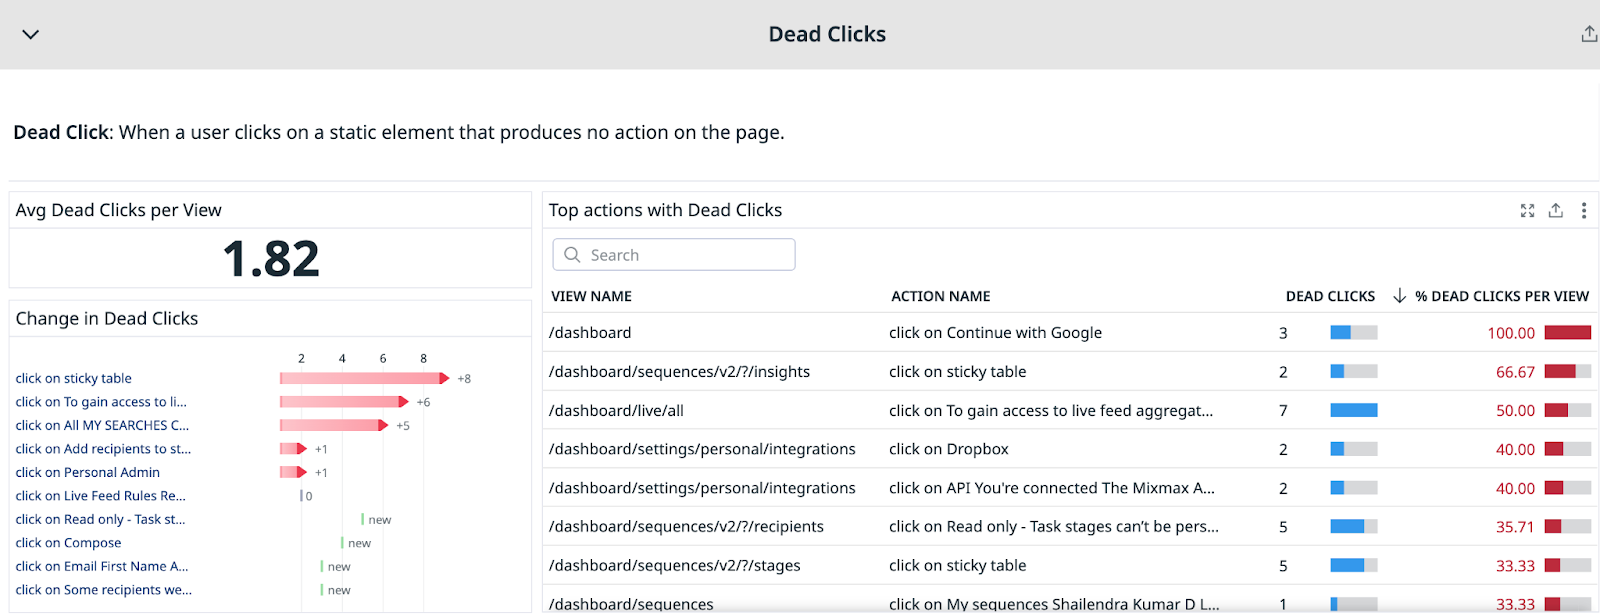
It will highlight areas where users expect functionality but don't receive any response. As well, indicate potential issues with non-working or improperly configured elements, or suggest user frustration due to unresponsive or dysfunctional elements.
Error Clicks:
Error clicks occur when users click on elements within an application and encounter error messages or unexpected outcomes. These errors can derive from various sources such as server issues, bugs in the code, or incorrect user interactions triggering unexpected responses.
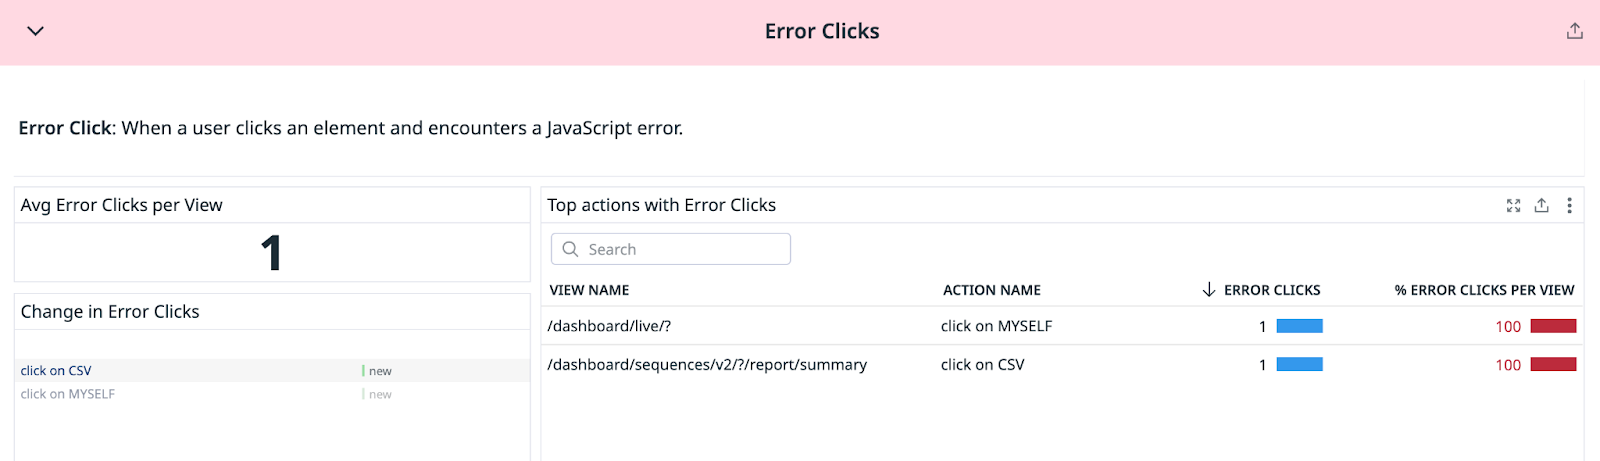
These logs will signal instances where user actions result in unexpected or undesired outcomes or indicate issues within the application that lead to error messages or dysfunctional pathways.
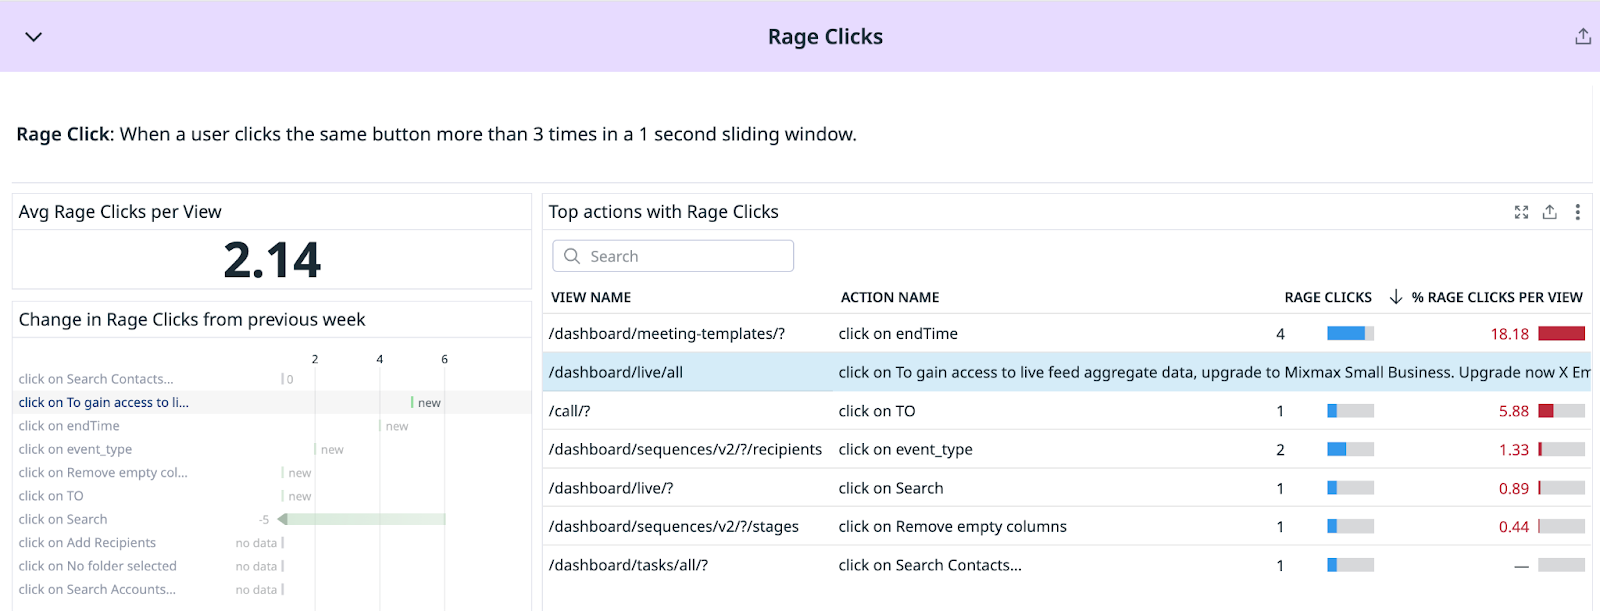
Rage Clicks:
Rage clicks represent instances where users repeatedly click on a specific element out of frustration or annoyance. These rapid, repetitive clicks often signify user dissatisfaction or confusion when interacting with an application.
It will show us reflected moments of heightened user frustration or irritation while navigating the app. Furthermore, logs will indicate areas where users experience significant dissatisfaction or confusion. Specifically important is that, we will get insights of and highlights of usability or functionality issues that lead to user frustration and potential abandonment.
Resolving these issues helped us to create a more user-friendly environment and prevent user dissatisfaction.
Leveraging Reduced Frustration Signals for Improvement
A decrease in dead clicks, error clicks, and rage clicks indicates an improved user experience. RUM dashboards empower us to address these issues systematically over time.
By addressing these issues:
- Usability: Fixing these problems makes our application easier to navigate and use, ultimately enhancing user satisfaction.
- User Engagement: Smooth functionality encourages users to explore more and engage more deeply.
- Enhanced User Satisfaction: Resolving these issues leads to happier users, which is essential for our success.
Conclusion
RUM dashboards have been instrumental in comprehending user needs and pain points, enabling us to elevate our quality standards. By actively listening to our clients or potential ones, we've optimised daily operations and precisely identified areas for improvement.
Embracing RUM dashboards goes beyond merely observing user behaviour; it's about leveraging that insight to craft exceptional experiences. This commitment not only sets a higher standard for quality but also ensures that our product consistently surpasses user expectations. Go ahead and check for yourself this valuable tool and make the most of its benefits!
Want to enhance quality at Mixmax? Visit Mixmax Careers.