


If you want to know why we have Snowflake in the first place, check out this blog by our previous Data Engineer!
I had a great welcome party after restarting Mixmax’s data team back in January 2022: small fires everywhere, alarms going off in pretty much all the data channels in Slack, Snowflake credits through the roof, and daily processes that had not been run for weeks. The reasons for how we got there were many and varied, but I had only one action plan available: roll up my sleeves and get down to work.
After analyzing the overall status of the warehouse, it became clear that all of the problems were related. Most of the data alarms were due to lack of information, inconsistencies, and SLA misses that would probably be solved once the processes started running again. At the same time, some processes were taking more than 24 hours to run, which is way too much. This led to the high expenses we incurred every month.
Getting Our Warehouse Running Again
I soon found out that the infamous process that took over a day to run was using external functions to check slightly different things in three separate occasions for each user. As our user base grew, so did the number of individuals that the process had to evaluate. Consequently, the third party used for that check couldn’t keep up with the amount of requests made by this task. The process ended up in a deadlock with itself once the 24-hour threshold was met, resulting in different schedules competing for the same resources.
The good news is that thanks to a brilliant Mixmax-er we were able to find the necessary information already being stored in a MongoDB collection that wasn’t a part of the DWH yet. Sure, it wasn’t exactly what we needed and we compromised on having that info updated once per day, but with a simple export-import and with some tweaks on the DWH side, we went from taking 24 hours to less than 4 minutes to run the end-to-end process!
Once that task was completed, it was beautiful to see how, one by one in a cascade-like sequence, each process reached success status in Airflow. Green never looked so good.
After the fix, all of the SLA alarms went away and all of the dashboards were showing information again. Only a handful of alerts regarding inconsistencies remained popping up in Slack. All was well in the world … or almost.
What Else Could We Have Done?
The graph shows how our Snowflake Credits evolved over time. January 2022 had half as many credits as December, as we were able to optimize the infamous 24-hour process by the end of the month, but I still couldn’t figure out why we’d had such a high peak in November 🤔.
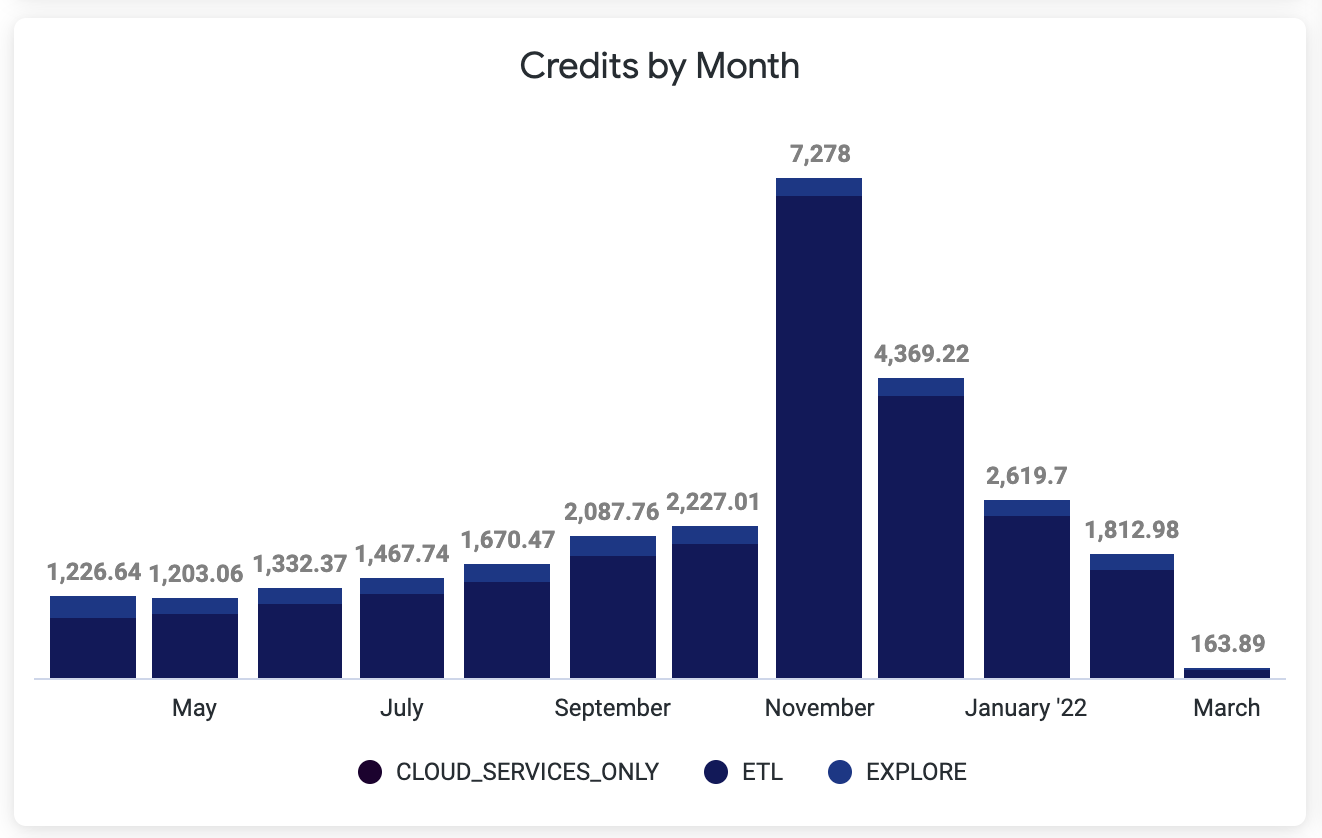
After digging further, I learned the Engineering Team had attempted to fix the extra-long process in November by using a well-known Engineering Principle: Does it take too long? Add resources!
Scaling up the cluster worked fine for a couple of days, but it was ultimately not enough and the process ended up in a deadlock again. What is more, scaling up also had the sour result of spending a lot more money than necessary on the underused extra size of cluster. As a test, scaling up the cluster wouldn’t have been that bad, but the experiment slipped the minds of the Engineering Team until they got the bill mid-December!
Moral of the story: Don’t forget to scale down after no longer needing the extra resources!
Cool, We Have Data Again! Now What?
Our greatest issue remained: why were we spending so much in Snowflake? Especially since there hadn’t been a data team in almost a year. Who (or what) was making so many queries?
Optimizing Processing
The Admin tools provided by Snowflake came in handy while trying to answer my question. By researching Snowflake’s querying history, I came up with one list of the queries that took the longest to run, and another list of the queries that went through the most amount of information. Three out of the top ten on each list matched, so those were the processes I fixed first.
I like to follow a principle when writing queries: only analyze what you need. Translated, this means to filter your data set as soon as possible to only keep the relevant information for answering your questions. Of course, this depends a lot on the tools you have, the model you created, and the kind of analysis you’re doing. But as a general rule, it works really well. By adding a few date filters here and join optimizations there, each of the three processes went to the bottom of their lists.
By fixing the infamously long process and through a few quick wins, I’d already reduced the credits by 10% of the amount forecasted for January—almost half of what we paid in December!
Plus, we could already see the impact in the overall statistics:
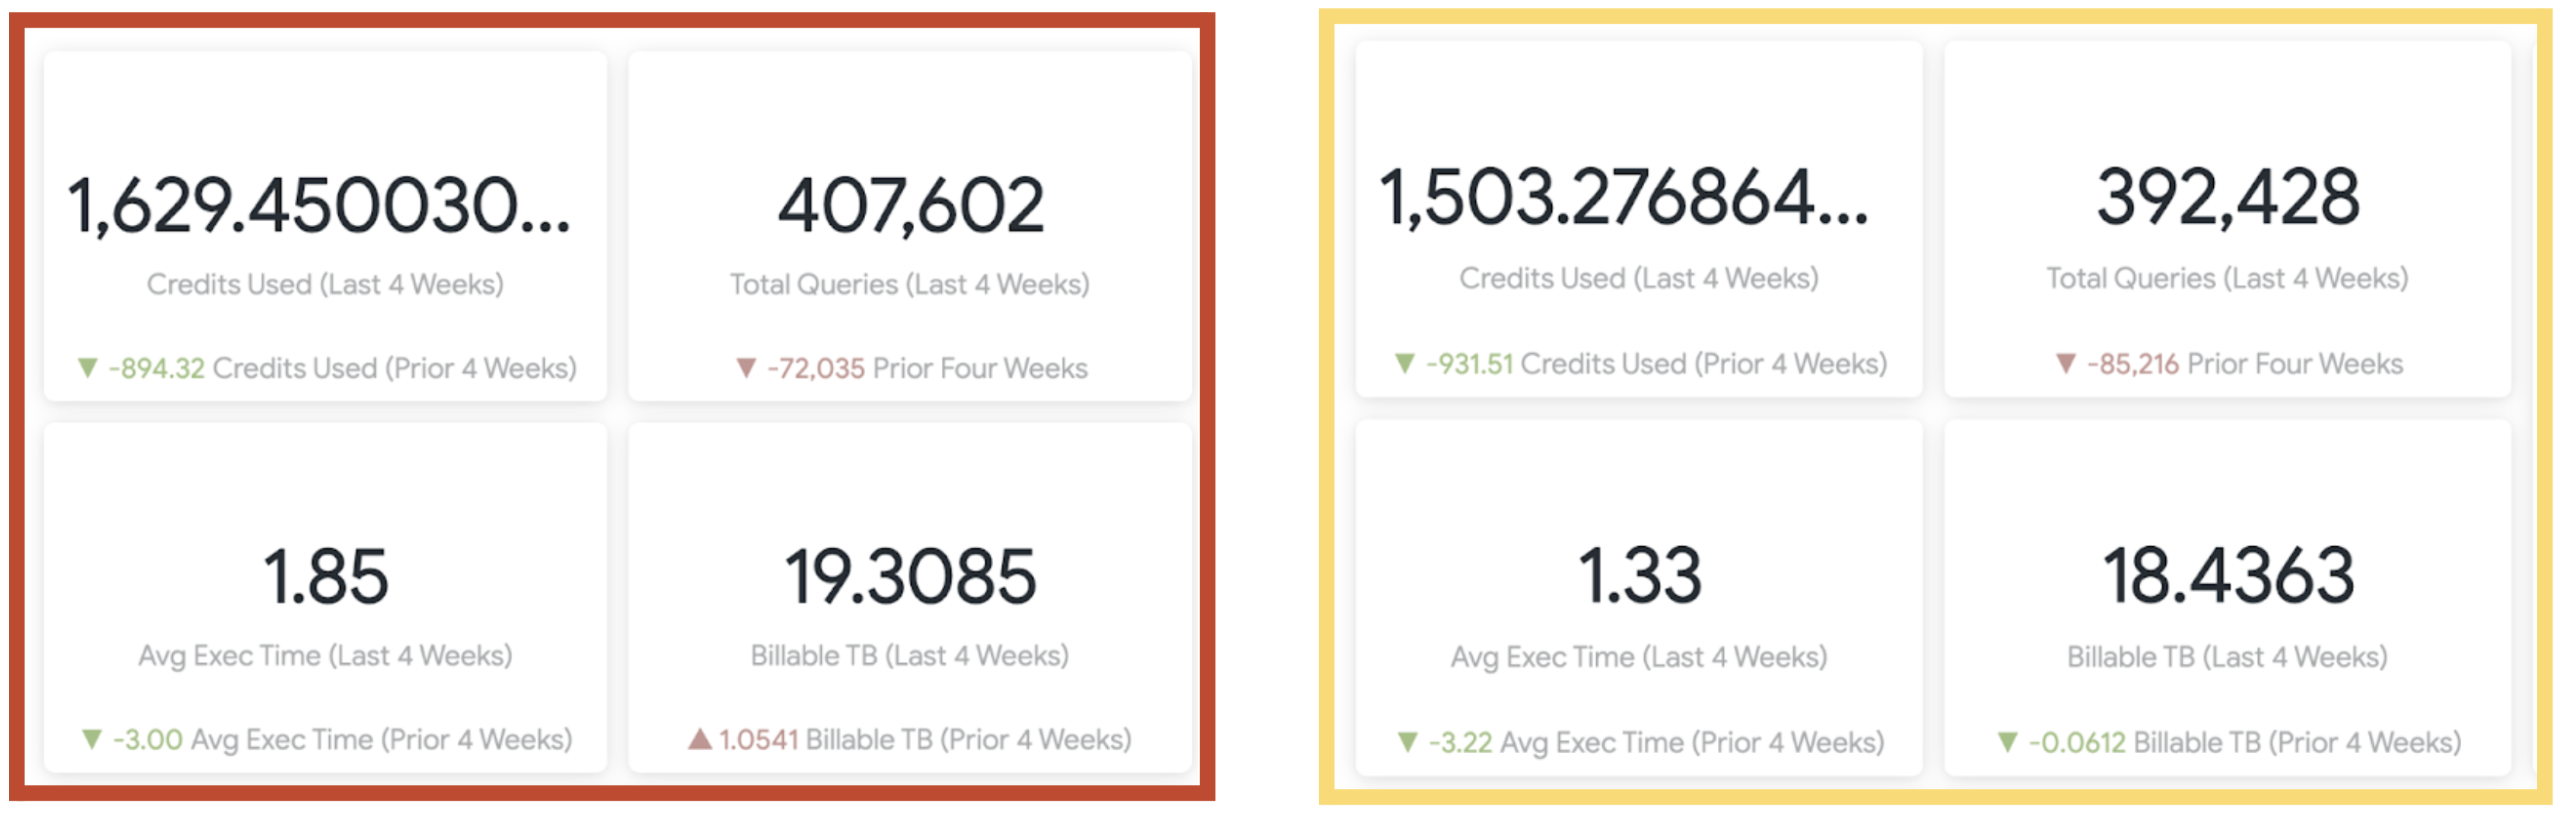
The pictures show the Statistics from Snowflake Usage reported by Looker. Only one week went by between snapshots, in February 2022. The decreases are directly linked to the optimizations run in between snapshots.
Not Enough!
As a perfectionist, I had to keep going. I made the decision to optimize at least the top twenty processes of each list before I actually started answering data questions (✨ get your house in order✨).
By the end of February, I'd tackled the highest consuming queries and reduced our costs by another 30% compared to what we paid in January. Reducing the amount of information analyzed in the very first step, improving the way our joins were done, and remodeling these processes into an incremental model when the use-case allowed it were the keys of my results.
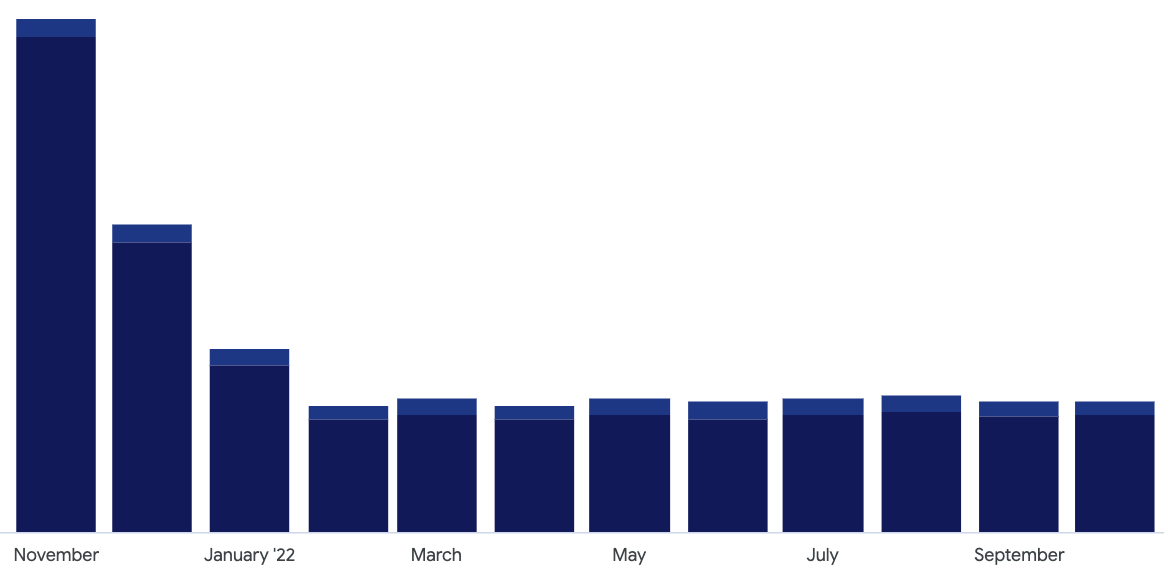
Keeping these steps in mind, along with the long-term plan to switch as many tables as it made sense to an incremental model as well, the costs of processing should’ve remained rather steady in the following months. We’d no longer have extra costs for re-processing, instead allowing us to use the budget in new developments and analysis. Going forward, our processing time and volume for pre-existing processes should only grow as our user-base/feature-usage grows.
Spoiler alert: it did! The forecasting was off by less than 2% in our favor, which means that we kept optimizing processes even more than we kept adding new ones.
And, the overall metrics improved as well. Remember what it looked like in February? Well, look at them now!
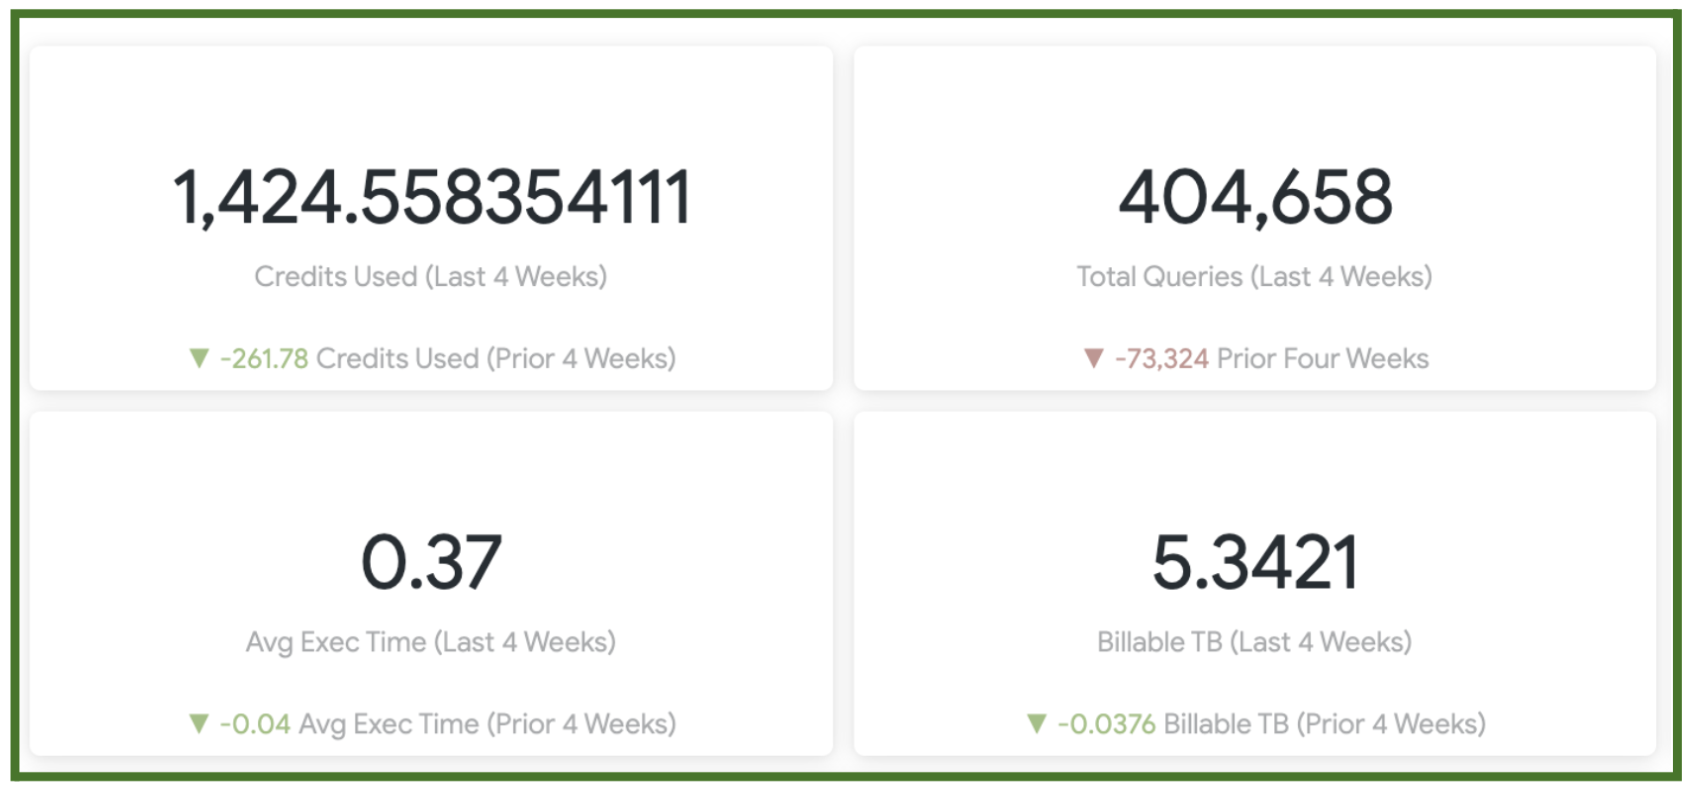
The Average Execution Time went from 1.85 to 0.37. That’s 5 times faster!
If you have an eye for detail, you probably spotted the optimizations achieved in Storage Billing as well. Stay tuned for a following blog where we’ll explore the Storage Billing case study.
Want to solve data problems? Visit Mixmax Careers.