This blog post is part of the Mixmax 2017 Advent Calendar. The previous post on December 10th was about Understanding query performance in Mongo.
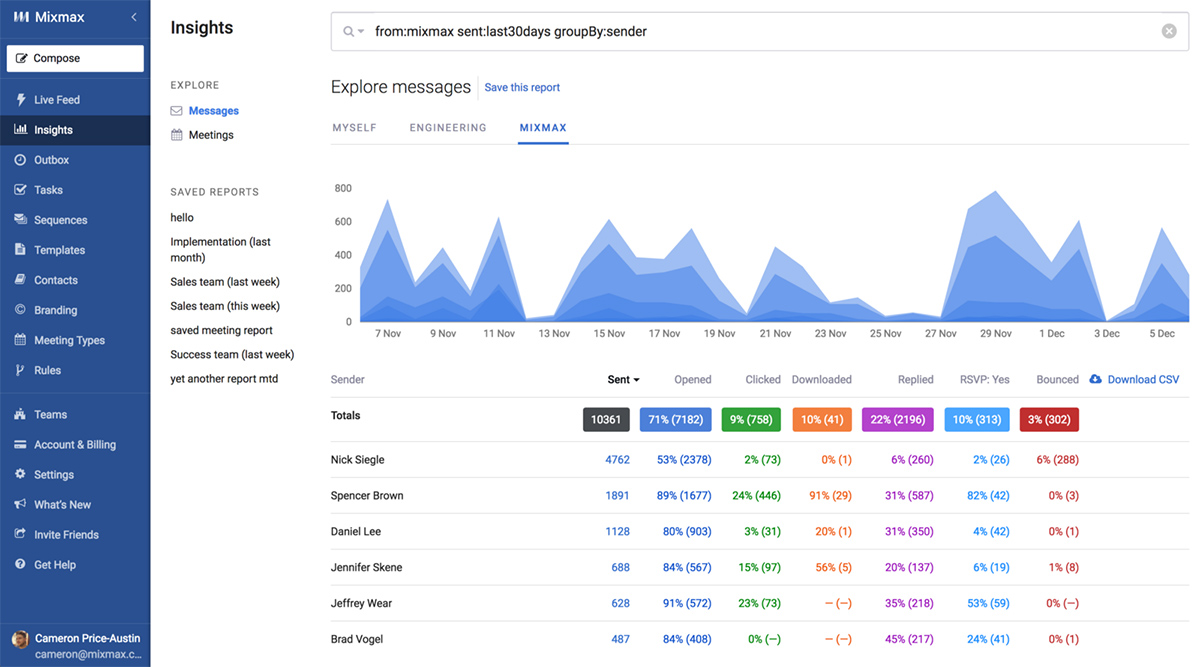
The Mixmax Insights dashboard is like Google Analytics for your mailbox. How many messages did I send? How many were opened? How many received replies? How do I compare to the rest of my team?

Just like Google Analytics, it provides a number of predefined views, but also lets users create custom reports based on their own filters and queries.
Under the hood, we use Elasticsearch to aggregate the data for these reports from a fairly large (~2 billion) dataset of messages.
We decided upon Elasticsearch after benchmarking a few candidate solutions, including AWS Redshift. As part of the Mixmax Engineering Blog Advent Calendar, I’ll explain the benchmarking process and results.
Requirements
Our solution needed to respond in real-time to ad-hoc, user-defined queries, returning aggregate statistics on matching messages, grouped by one or more fields (sender, time etc).
Ideally, it also needed to be capable of serving existing analytics elsewhere in our app, such as the sequence reports and live feed, which at the time were served using an ugly system of pre-cached fields in Mongo.
It needed to operate at our current scale, house at least twelve months of historic data, and be capable of growing with our customer base, continuing to serve our needs for at least the next year.
Candidates
Mongo
We use Mongo as our primary data store, so the idea of using a familiar technology was attractive. We figured we might be able to use Mongo’s aggregate feature across a single, large, heavily-denormalized collection of messages.
Elasticsearch
Like Mongo, Elasticsearch was already part of our stack. We’d been using it to serve our live feed and had already found it quite capable of producing aggregated analytics in real-time (despite some early teething issues).
Redshift
Redshift was, in our mind, the gold-standard of data warehousing and retrieval. Our team didn’t have any experience with it, but we knew of other startups who employed it for similar use cases.
Implementation
Message data has some one-to-many relationships. For example, each message has one or more recipients. In our system, it can also contain zero or more templates, and each user (and therefore their messages) can belong to zero or more teams.
Mongo and Elasticsearch allow us to express these relationships on a single document (using Array types), but Redshift is relational, and required additional tables. Our final schema for Redshift was:
CREATE TYPE message_type AS ENUM (‘normal’, ‘sequence’, ‘template’);
CREATE TABLE messages (
  _id varchar(24) not null distkey primary key,
  userId varchar(24) not null,
  sent integer not null sortkey,
  numRecipients smallint not null,
  numOpened smallint not null,
  numClicked smallint not null,
  numDownloaded smallint not null,
  numReplied smallint not null,
  numBounced smallint not null,
  firstOpen integer,
  lastOpen integer,
  firstClick integer,
  lastClick integer,
  firstDownload integer,
  lastDownload integer,
  firstReply integer,
  lastReply integer
);
CREATE TABLE messages_teams (
  messageId varchar(24) not null distkey encode lzo,
  teamId varchar(24) sortkey not null encode lzo,
  primary key (messageId, teamId),
  foreign key (messageId) references messages(_id)
);
CREATE TABLE recipients (
  messageId varchar(24) not null distkey,
  email varchar(254) not null,
  domain varchar(250) not null sortkey,
  primary key (messageId, email),
  foreign key (messageId) references messages(_id)
);
CREATE TABLE messages_templates (
  messageId varchar(24) not null distkey encode lzo,
  templateId varchar(24) sortkey not null encode lzo,
  primary key (messageId, templateId),
  foreign key (messageId) references messages(_id)
);
We distributed all tables on the message id. For messages, this essentially distributed rows across nodes in a round-robin. For the FK tables, this ensured they were co-located on the same node as their parent message.
We also set sort keys (essentially cluster indexes) on the dimensions used for querying.
Benchmark Process
- We set up each candidate system and populated it with 100m sample messages (based on real, anonymized user data) from 40k users
- We continued to stream in new messages and edits to existing messages (e.g. incrementing
numClicksetc.) at a rate of 10 writes per second, simulating our approximate update load - We executed a sustained series of pre-defined queries against each solution at a rate of 100 per second (roughly what we expected in production usage)
- We then averaged the response times
The queries were:
- Query A — User’s own activity for specific month, grouped by day
- Query B — User’s own activity over entire year, grouped by week
- Query C — Team activity for specific month, grouped by user
- Query D — Team activity for specific month, grouped by recipient domain
- Query E — Team activity for specific month and domain, grouped by user
- Query F — Team activity for specific month, grouped by template
Results
Mongo needed to be excluded early on. It completely choked at this load profile, taking ~10 minutes (!) to return results. Elasticsearch and Redshift performed better:
 Average response time (ms) for each query. For Elasticsearch we used an elastic.co hosted 16GB, 2DC profile.
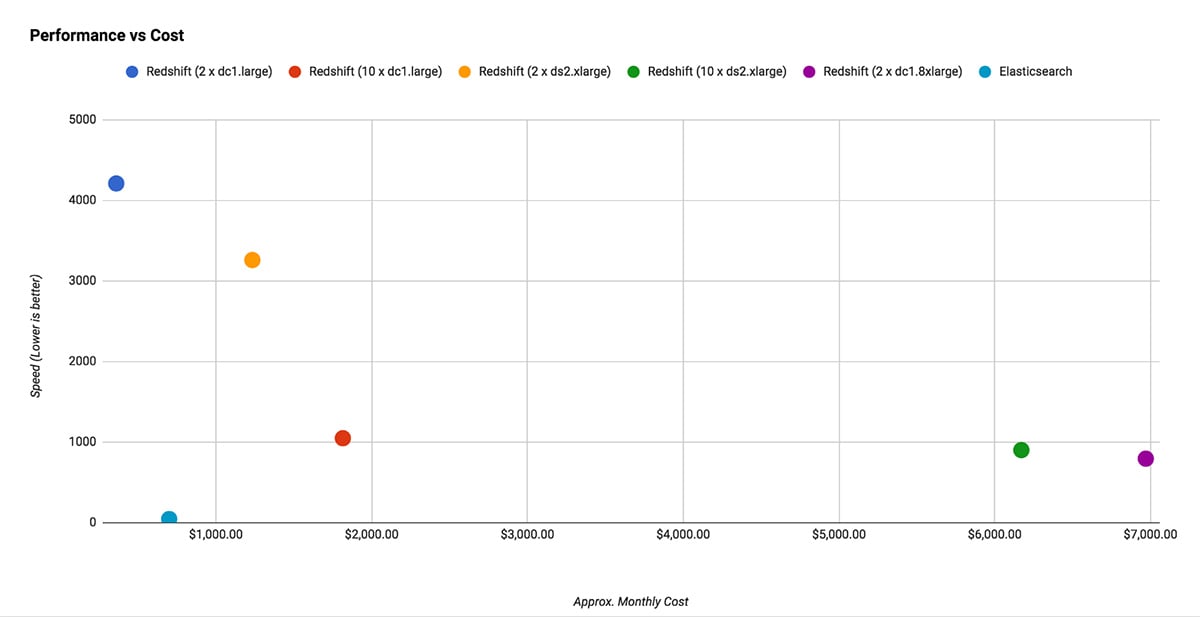
Taking the speed average and plotting it as a function of estimated monthly cost:

Conclusion
Elasticsearch was the clear winner. It was the fastest (by far) and comparatively cheap.
This was surprising. We don’t have much experience with Redshift, but it seems like each query suffers from a startup penalty of ~1s (possibly Redshift analysing the query and splitting it between nodes?). It might be more suited as a solution for data scientists rather than as part of an application stack.
We’ve now been using our Elasticsearch reporting cluster in production for about six months and performance has been great (especially on Elasticsearch v5). We did need to upgrade to a 32GB instance as we added additional indexes, but overall the performance-to-price ratio is still excellent, and we’ve been happy with our choice.
Notes
- In Redshift, we tried setting the message id as both the
distkeyandsortkey, so the query optimiser could perform merge joins, but this hurt performance instead of improving it - We set primary and foreign keys, but these aren’t enforced in Redshift — it just uses them to improve its query planner. Adding them didn’t noticeably improve performance.
- We performed encoding optimisation on all tables. Apart from the few explicit codings set in the FK tables, these were already optimal.
- We added numeric boolean columns like
wasOpened(which is either0or1). These were redundant given we havenumOpens, but allowed us to do aggregate operations (such asSUM(wasOpened)) without needing to use a case statement (e.g.SUM(CASE WHEN numOpened = 0 THEN 0 ELSE 1 END)). This improved performance quite a bit.
Have a knack for engineering solutions to software problems that prioritize user experience? We’re hiring!


